Data Visualization and Mapping
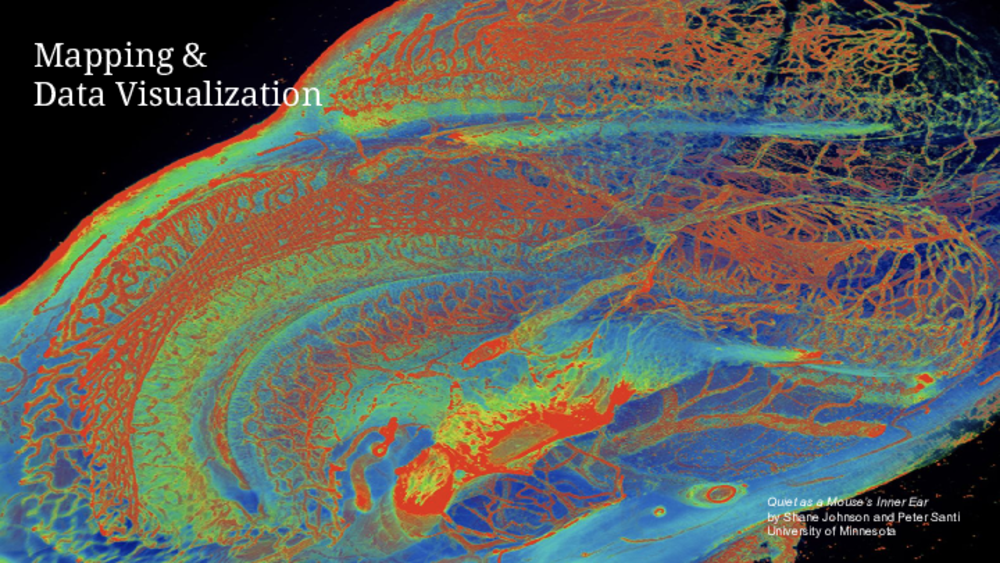

Scientists and artists use certain design techniques to present complex data sets in a systematic way. This resource includes a brief visual history of information design and a paired activity that could be used with any content.
1. View the slideshow and discuss different forms of data visualization
2. Activity: Represent your information in a visual “map.”
Using statistics as your starting point, create a graphic form that best fits the given information. Consider the relationship of form and content; for example, would a flowchart, grid, or geographic map be the best choice?
Also think about what is left out. Can excluding information help clarify a visual? What does it communicate about your viewpoint?
Example: Artist Enrique Chagoya compiled many viewpoints about public health and layered them to produce a complex “map.” This multi-media approach is encouraged and could be supported with textual explanation.
Created For
K-12 EducatorK-12 Student
Museum Visitor
UMMA Docent
UMMA Staff
University Faculty
University Student
Rate this Resource
AVG: 0 | Ratings: 0
& Author Notes
Creative Commons by-nc-saLast Updated
May 23, 2017 11:40 a.m.Report
Reporting Policy
